Administration Guides
Check Log Collection
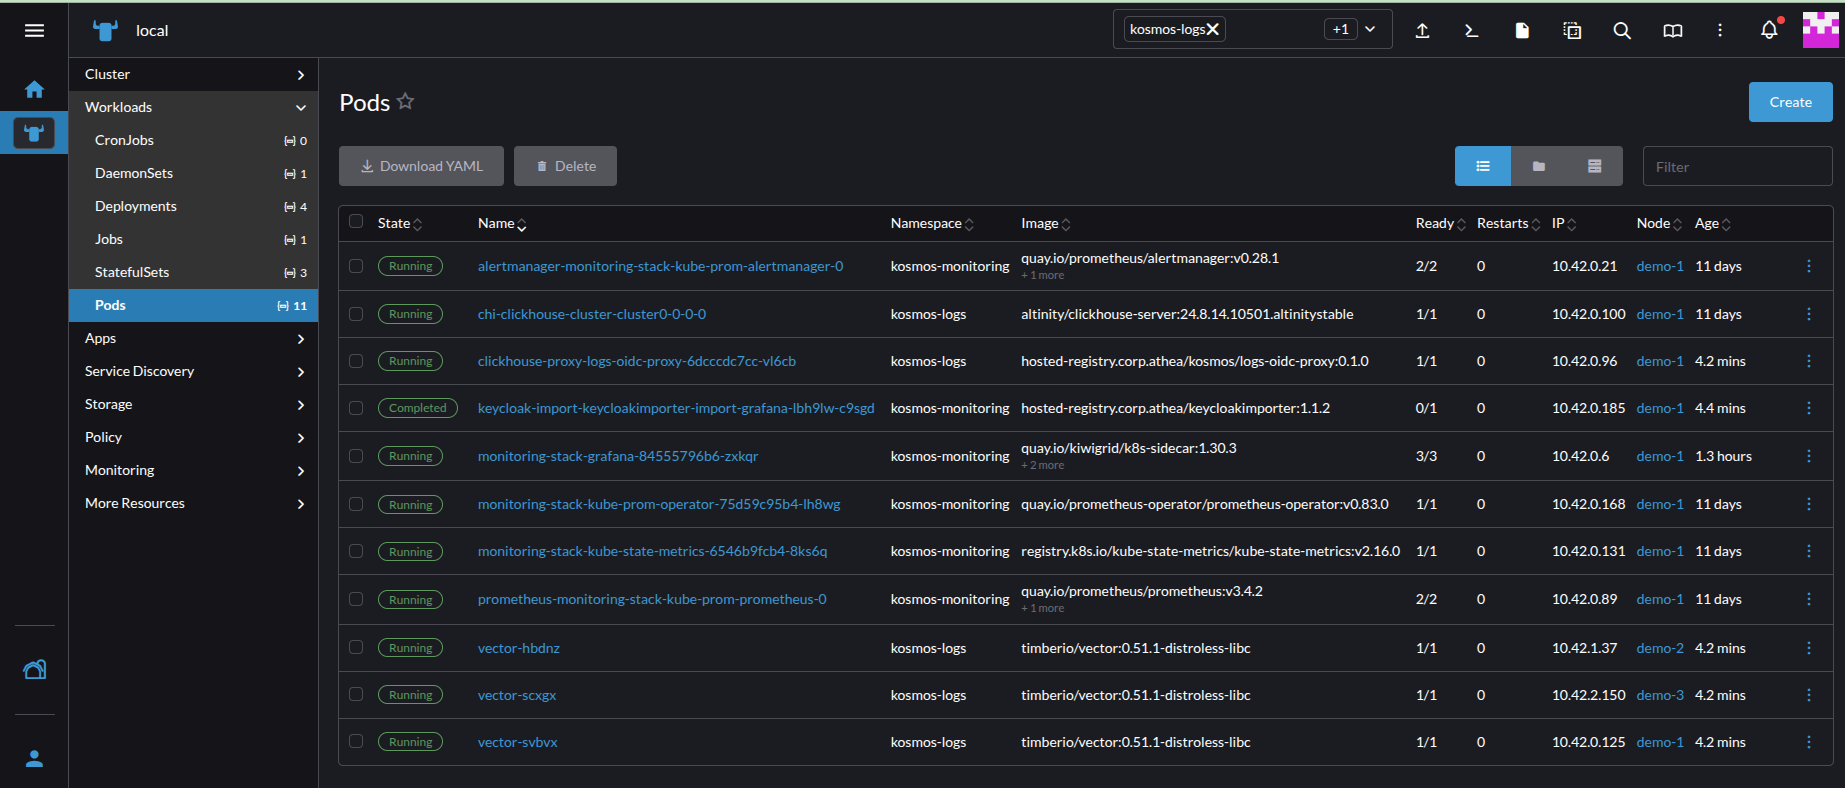
All pods in this namespace must be up and running.
Check Vector
If you encounter a problem, you can view the vector logs (namespace: kosmos-logs).
There must be no errors in the logs.
[...]
2025-04-18T12:52:39.197749Z  INFO source{component_kind="source" component_id=kubernetes_logs component_type=kubernetes_logs}:file_server: vector::internal_events::file::source: Stopped watching file. file=/var/log/pods/tenant0-vstore_vstore-7495dd8499-jnmfc_04096f94-6d30-47ee-9e88-b97cfdba908c/vstore/69.log reached_eof="true"
2025-04-18T12:57:38.605139Z  INFO source{component_kind="source" component_id=kubernetes_logs component_type=kubernetes_logs}:file_server: vector::internal_events::file::source: Found new file to watch. file=/var/log/pods/tenant0-vstore_vstore-7495dd8499-jnmfc_04096f94-6d30-47ee-9e88-b97cfdba908c/vstore/71.log
2025-04-18T12:57:38.869374Z  INFO source{component_kind="source" component_id=kubernetes_logs component_type=kubernetes_logs}:file_server: vector::internal_events::file::source: Stopped watching file. file=/var/log/pods/tenant0-vstore_vstore-7495dd8499-jnmfc_04096f94-6d30-47ee-9e88-b97cfdba908c/vstore/70.log reached_eof="true"
2025-04-18T13:02:39.362356Z  INFO source{component_kind="source" component_id=kubernetes_logs component_type=kubernetes_logs}:file_server: vector::internal_events::file::source: Found new file to watch. file=/var/log/pods/tenant0-vstore_vstore-7495dd8499-jnmfc_04096f94-6d30-47ee-9e88-b97cfdba908c/vstore/72.log
2025-04-18T13:02:47.617641Z  INFO source{component_kind="source" component_id=kubernetes_logs component_type=kubernetes_logs}:file_server: vector::internal_events::file::source: Stopped watching file. file=/var/log/pods/tenant0-vstore_vstore-7495dd8499-jnmfc_04096f94-6d30-47ee-9e88-b97cfdba908c/vstore/71.log reached_eof="true"
[...]
Check ClickHouse
- Connect to the database
kosmos
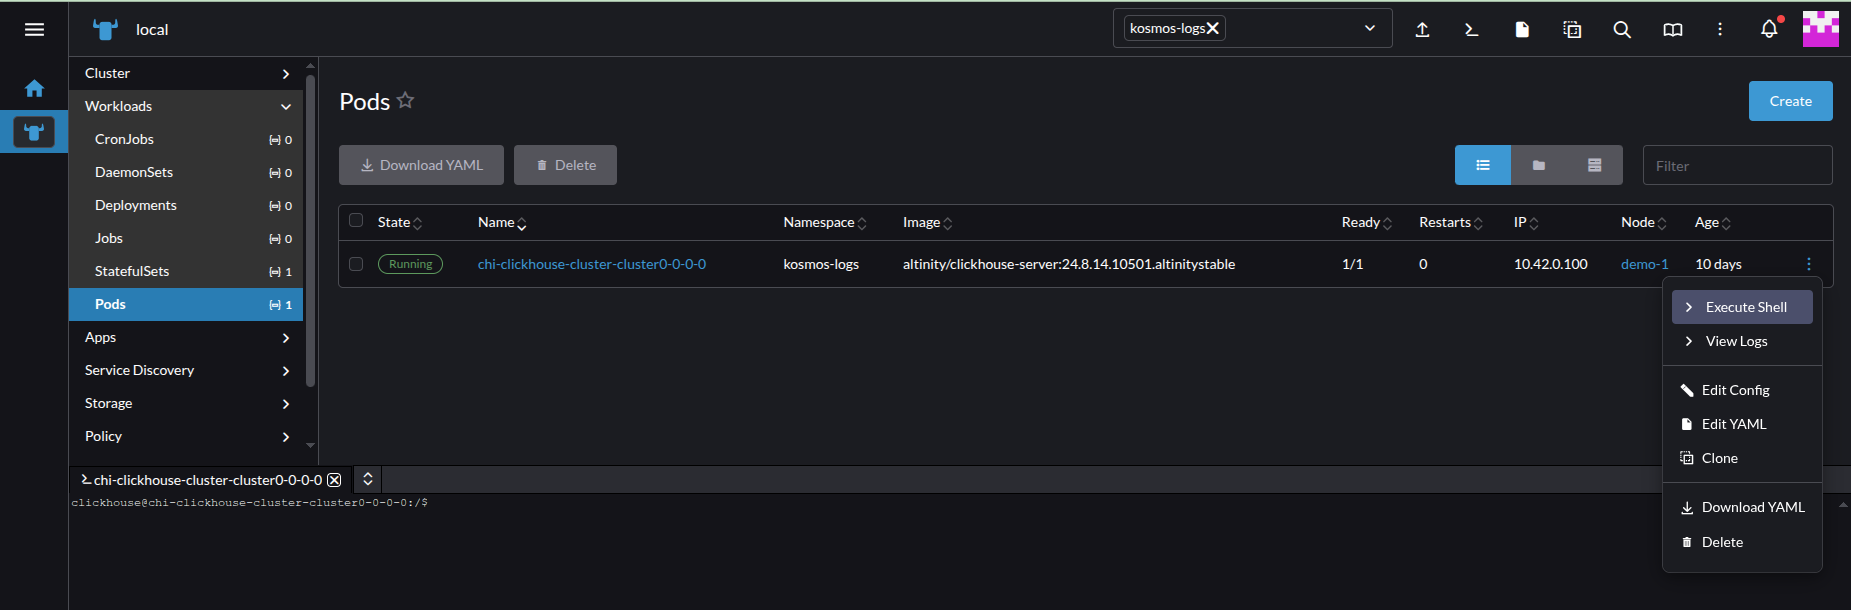
ch-logsuser password can be retrieved with the command:
kubectl get secret ch-logs -n kosmos-logs -o jsonpath='{.data.kosmos}' | base64 --decode
clickhouse-client -u kosmos --password <password> -h 127.0.0.1 -d kosmos

ClickHouse client version 24.8.11.51285.altinitystable (altinity build).
Connecting to database kosmos at localhost:9000 as user kosmos.
Connected to ClickHouse server version 24.8.11.

Warnings:
 * Delay accounting is not enabled, OSIOWaitMicroseconds will not be gathered. You can enable it using `echo 1 > /proc/sys/kernel/task_delayacct` or by using sysctl.
 * Table system.session_log is enabled. It's unreliable and may contain garbage. Do not use it for any kind of security monitoring.

chi-clickhouse-cluster-tec-cluster-0-0-0.chi-clickhouse-cluster-tec-cluster-0-0.kosmos-logs.svc.cluster.local :)
Check for the presence of the following tables:
-
audit_iaas -
kosmos_audit -
kosmos_logs -
Check the tables
:) show tables
SHOW TABLES

Query id: 7fdc0134-a78d-4167-aa6d-fd52afec86a2

   ┌─name─────────┐
1. │ audit_iaas   │
2. │ kosmos_audit │
3. │ kosmos_logs  │
   └──────────────┘

3 rows in set. Elapsed: 0.003 sec.
- Check for recent logs
:) select * from kosmos_logs where timestamp >= now() - INTERVAL 1 MINUTE ORDER BY timestamp ASC
- Check for recent logs in tables
  │ c1dr-pprod-worker-4      │ abde0b5f-3fbf-4e36-9378-f34b61b57248 │ I0418 13:42:40.660628       1 main.go:96] "Received GetInfo call" request="&InfoRequest{}"                                                                                                                                                                 │ 2025-04-18 13:42:40.660 │           │
1.    │ {"cnpg.io/cluster":"postgresql-metier-cluster","cnpg.io/instanceName":"postgresql-metier-cluster-1","cnpg.io/instanceRole":"primary","cnpg.io/podRole":"instance","role":"primary"}                                                                        │ registry.c1dr-pprod.athea:3000/athea/hosted-registry.corp.athea/artemis/infostructure/socle/service-applicatif/postgresql-fat:16-3.4.1  │ registry.c1dr-pprod.athea:3000/athea/hosted-registry.corp.athea/artemis/infostructure/socle/service-applicatif/postgresql-fat@sha256:ac7266ff215b8eb186d9f15fe482fac17b209a02a601be57b682d96b22275034     │ postgres                  │ postgresql-metier-cluster-1                        │ tenant0-pg               │ c1dr-pprod-worker-3      │ 6fd94ca4-0ffa-48f7-a855-005d349fd8a8 │ {"level":"info","ts":"2025-04-18T13:42:41Z","logger":"postgres","msg":"record","logging_pod":"postgresql-metier-cluster-1","record":{"log_time":"2025-04-18 13:42:41.234 UTC","process_id":"1210386","connection_from":"[local]","session_id":"680256d1.127812","session_line_num":"1","session_start_time":"2025-04-18 13:42:41 UTC","transaction_id":"0","error_severity":"LOG","sql_state_code":"00000","message":"connection received: host=[local]","backend_type":"not initialized","query_id":"0"}} │ 2025-04-18 13:42:41.235 │           │
2.    │ {"app":"webservice","app.kubernetes.io/name":"gitlab","app.kubernetes.io/version":"v17.9.1","chart":"webservice-8.9.1","gitlab.com/webservice-name":"default","heritage":"Helm","pod-template-hash":"7b945cb894","release":"gitlab"}                       │ registry.gitlab.com/gitlab-org/build/cng/gitlab-webservice-ce:v17.9.1                                                                   │ registry.gitlab.com/gitlab-org/build/cng/gitlab-webservice-ce@sha256:c77705b8540b788c29c439e154e4b3e992de69095734de624b405f6b216b802a                                                                     │ webservice                │ gitlab-webservice-default-7b945cb894-2v5qv         │ kosmos-dev               │ c1dr-pprod-worker-3      │ 8bb4c265-e8ab-4c82-9a19-88d879e5a524 │ {"component": "gitlab","subcomponent":"api_json","time":"2025-04-18T13:42:41.279Z","severity":"INFO","duration_s":0.01771,"db_duration_s":0.00183,"view_duration_s":0.01588,"status":200,"method":"POST","path":"/api/v4/runners/verify","params":[{"key":"token","value":"[FILTERED]"},{"key":"system_id","value":"r_SRzd5oRAmqRY"}],"host":"gitlab-webservice-default.kosmos-dev.svc.cluster.local","remote_ip":"10.42.1.195","ua":"gitlab-runner 17.7.0 (17-7-stable; go1.23.2; linux/amd64)","route":"/api/:version/runners/verify","queue_duration_s":0.010186,"redis_calls":12,"redis_duration_s":0.004635,"redis_read_bytes":297,"redis_write_bytes":1049,"redis_cache_calls":4,"redis_cache_duration_s":0.00192,"redis_cache_read_bytes":297,"redis_cache_write_bytes":449,"redis_db_load_balancing_calls":8,"redis_db_load_balancing_duration_s":0.002715,"redis_db_load_balancing_write_bytes":600,"db_count":2,"db_write_count":0,"db_cached_count":0,"db_txn_count":0,"db_replica_txn_count":0,"db_primary_txn_count":0,"db_replica_count":0,"db_primary_count":2,"db_replica_write_count":0,"db_primary_write_count":0,"db_replica_cached_count":0,"db_primary_cached_count":0,"db_replica_wal_count":0,"db_primary_wal_count":0,"db_replica_wal_cached_count":0,"db_primary_wal_cached_count":0,"db_replica_txn_max_duration_s":0.0,"db_primary_txn_max_duration_s":0.0,"db_replica_txn_duration_s":0.0,"db_primary_txn_duration_s":0.0,"db_replica_duration_s":0.0,"db_primary_duration_s":0.002,"db_main_txn_count":0,"db_ci_txn_count":0,"db_main_replica_txn_count":0,"db_ci_replica_txn_count":0,"db_main_count":0,"db_ci_count":2,"db_main_replica_count":0,"db_ci_replica_count":0,"db_main_write_count":0,"db_ci_write_count":0,"db_main_replica_write_count":0,"db_ci_replica_write_count":0,"db_main_cached_count":0,"db_ci_cached_count":0,"db_main_replica_cached_count":0,"db_ci_replica_cached_count":0,"db_main_wal_count":0,"db_ci_wal_count":0,"db_main_replica_wal_count":0,"db_ci_replica_wal_count":0,"db_main_wal_cached_count":0,"db_ci_wal_cached_count":0,"db_main_replica_wal_cached_count":0,"db_ci_replica_wal_cached_count":0,"db_main_txn_max_duration_s":0.0,"db_ci_txn_max_duration_s":0.0,"db_main_replica_txn_max_duration_s":0.0,"db_ci_replica_txn_max_duration_s":0.0,"db_main_txn_duration_s":0.0,"db_ci_txn_duration_s":0.0,"db_main_replica_txn_duration_s":0.0,"db_ci_replica_txn_duration_s":0.0,"db_main_duration_s":0.0,"db_ci_duration_s":0.002,"db_main_replica_duration_s":0.0,"db_ci_replica_duration_s":0.0,"cpu_s":0.025147,"mem_objects":7316,"mem_bytes":580992,"mem_mallocs":1850,"mem_total_bytes":873632,"pid":107,"worker_id":"puma_1","rate_limiting_gates":[],"correlation_id":"01JS4J68AZJPTV6GYH9JPJ9WQT","meta.caller_id":"POST /api/:version/runners/verify","meta.remote_ip":"10.42.1.195","meta.feature_category":"runner","meta.client_id":"runner/1","content_length":"64","request_urgency":"low","target_duration_s":5} │ 2025-04-18 13:42:41.280 │           │
3.    │ {"app":"webservice","app.kubernetes.io/name":"gitlab","app.kubernetes.io/version":"v17.9.1","chart":"webservice-8.9.1","gitlab.com/webservice-name":"default","heritage":"Helm","pod-template-hash":"7b945cb894","release":"gitlab"}                       │ registry.gitlab.com/gitlab-org/build/cng/gitlab-workhorse-ce:v17.9.1                                                                    │ registry.gitlab.com/gitlab-org/build/cng/gitlab-workhorse-ce@sha256:4da0104d406f170947b0df7d9c4e03e4b5e928bf4e130cf38cdd2eaf139a620c                                                                      │ gitlab-workhorse          │ gitlab-webservice-default-7b945cb894-2v5qv         │ kosmos-dev               │ c1dr-pprod-worker-3      │ 8bb4c265-e8ab-4c82-9a19-88d879e5a524 │ {"backend_id":"rails","content_type":"application/json","correlation_id":"01JS4J68AZJPTV6GYH9JPJ9WQT","duration_ms":35,"host":"gitlab-webservice-default.kosmos-dev.svc.cluster.local:8181","level":"info","method":"POST","msg":"access","proto":"HTTP/1.1","referrer":"","remote_addr":"10.42.1.195:54324","remote_ip":"10.42.1.195","route":"^/api/","route_id":"api","status":200,"system":"http","time":"2025-04-18T13:42:41Z","ttfb_ms":35,"uri":"/api/v4/runners/verify","user_agent":"gitlab-runner 17.7.0 (17-7-stable; go1.23.2; linux/amd64)","written_bytes":66} │ 2025-04-18 13:42:41.283 │           │
4.    │ {"cnpg.io/cluster":"postgresql-metier-cluster","cnpg.io/instanceName":"postgresql-metier-cluster-1","cnpg.io/instanceRole":"primary","cnpg.io/podRole":"instance","role":"primary"}                                                                        │ registry.c1dr-pprod.athea:3000/athea/hosted-registry.corp.athea/artemis/infostructure/socle/service-applicatif/postgresql-fat:16-3.4.1  │ registry.c1dr-pprod.athea:3000/athea/hosted-registry.corp.athea/artemis/infostructure/socle/service-applicatif/postgresql-fat@sha256:ac7266ff215b8eb186d9f15fe482fac17b209a02a601be57b682d96b22275034     │ postgres                  │ postgresql-metier-cluster-1                        │ tenant0-pg               │ c1dr-pprod-worker-3      │ 6fd94ca4-0ffa-48f7-a855-005d349fd8a8 │ {"level":"info","ts":"2025-04-18T13:42:41Z","logger":"postgres","msg":"record","logging_pod":"postgresql-metier-cluster-1","record":{"log_time":"2025-04-18 13:42:41.842 UTC","process_id":"1210388","connection_from":"[local]","session_id":"680256d1.127814","session_line_num":"1","session_start_time":"2025-04-18 13:42:41 UTC","transaction_id":"0","error_severity":"LOG","sql_state_code":"00000","message":"connection received: host=[local]","backend_type":"not initialized","query_id":"0"}} │ 2025-04-18 13:42:41.842 │           │
5.    │ {"cnpg.io/cluster":"postgresql-technique-cluster","cnpg.io/instanceName":"postgresql-technique-cluster-1","cnpg.io/instanceRole":"primary","cnpg.io/podRole":"instance","role":"primary"}                                                                  │ ghcr.io/cloudnative-pg/postgresql:16.3-4                                                                                                │ ghcr.io/cloudnative-pg/postgresql@sha256:db1c75488268a5251acdbe21a69fddcefcf8c861b2319a1c3aecdb443b34086d                                                                                                 │ postgres                  │ postgresql-technique-cluster-1                     │ kosmos-sql               │ c1dr-pprod-worker-3      │ 75385ecb-3ae3-41d8-8b51-61b1d7876024 │ {"level":"info","ts":"2025-04-18T13:42:41Z","logger":"postgres","msg":"record","logging_pod":"postgresql-technique-cluster-1","record":{"log_time":"2025-04-18 13:42:41.985 UTC","process_id":"1843676","connection_from":"10.42.2.69:56272","session_id":"680256d1.1c21dc","session_line_num":"1","session_start_time":"2025-04-18 13:42:41 UTC","transaction_id":"0","error_severity":"LOG","sql_state_code":"00000","message":"connection received: host=10.42.2.69 port=56272","backend_type":"not initialized","query_id":"0"}} │ 2025-04-18 13:42:41.986 │           │
6.    │ {"app":"gitlab-shell","app.kubernetes.io/name":"gitlab","app.kubernetes.io/version":"v17.9.1","chart":"gitlab-shell-8.9.1","heritage":"Helm","pod-template-hash":"66c8d67f48","release":"gitlab"}                                                          │ registry.gitlab.com/gitlab-org/build/cng/gitlab-shell:v14.40.0                                                                          │ registry.gitlab.com/gitlab-org/build/cng/gitlab-shell@sha256:ad43d151ebd5f7cd3444dbd9e747ac393fa9d628ce37ad434a0ad4125a1e2b73                                                                             │ gitlab-shell              │ gitlab-gitlab-shell-66c8d67f48-zbf6t               │ kosmos-dev               │ c1dr-pprod-worker-4      │ 03c424ae-2f40-47c4-a5a5-6af3b5bcf118 │ {"component": "gitlab-shell","subcomponent":"ssh","time":"2025-04-18T13:42:42Z","message":"kex_exchange_identification: Connection closed by remote host\r"}                                                                                               │ 2025-04-18 13:42:42.239 │           │
7.    │ {"app.kubernetes.io/component":"node","app.kubernetes.io/instance":"topolvm","app.kubernetes.io/name":"topolvm","controller-revision-hash":"6697bcbd48","pod-template-generation":"2"}                                                                     │ ghcr.io/topolvm/topolvm-with-sidecar:0.36.0                                                                                             │ ghcr.io/topolvm/topolvm-with-sidecar@sha256:95673bd4b93103ba97e641a637ae63d0e386e7a5405da8c13a04181ecc23d843                                                                                              │ topolvm-node              │ topolvm-node-zsd6q                                 │ kosmos-system            │ c1dr-pprod-worker-3      │ 17da662f-61a6-45ec-bb3e-a0ff7d2e918f │ {"level":"info","ts":"2025-04-18T13:42:42Z","logger":"driver.node","msg":"NodeGetVolumeStats is called","volume_id":"759e9b3d-0d73-4e73-b22f-c76baf8afd59","volume_path":"/var/lib/kubelet/pods/e6b127ac-3307-4e52-b4da-d614fd542223/volumes/kubernetes.io~csi/pvc-8fdcf657-4556-469c-a5e5-2160d2ff4628/mount"} │ 2025-04-18 13:42:42.401 │           │

3496 rows in set. Elapsed: 0.033 sec. Processed 1.11 million rows, 14.52 MB (33.56 million rows/s., 440.14 MB/s.)
Peak memory usage: 5.09 MiB.
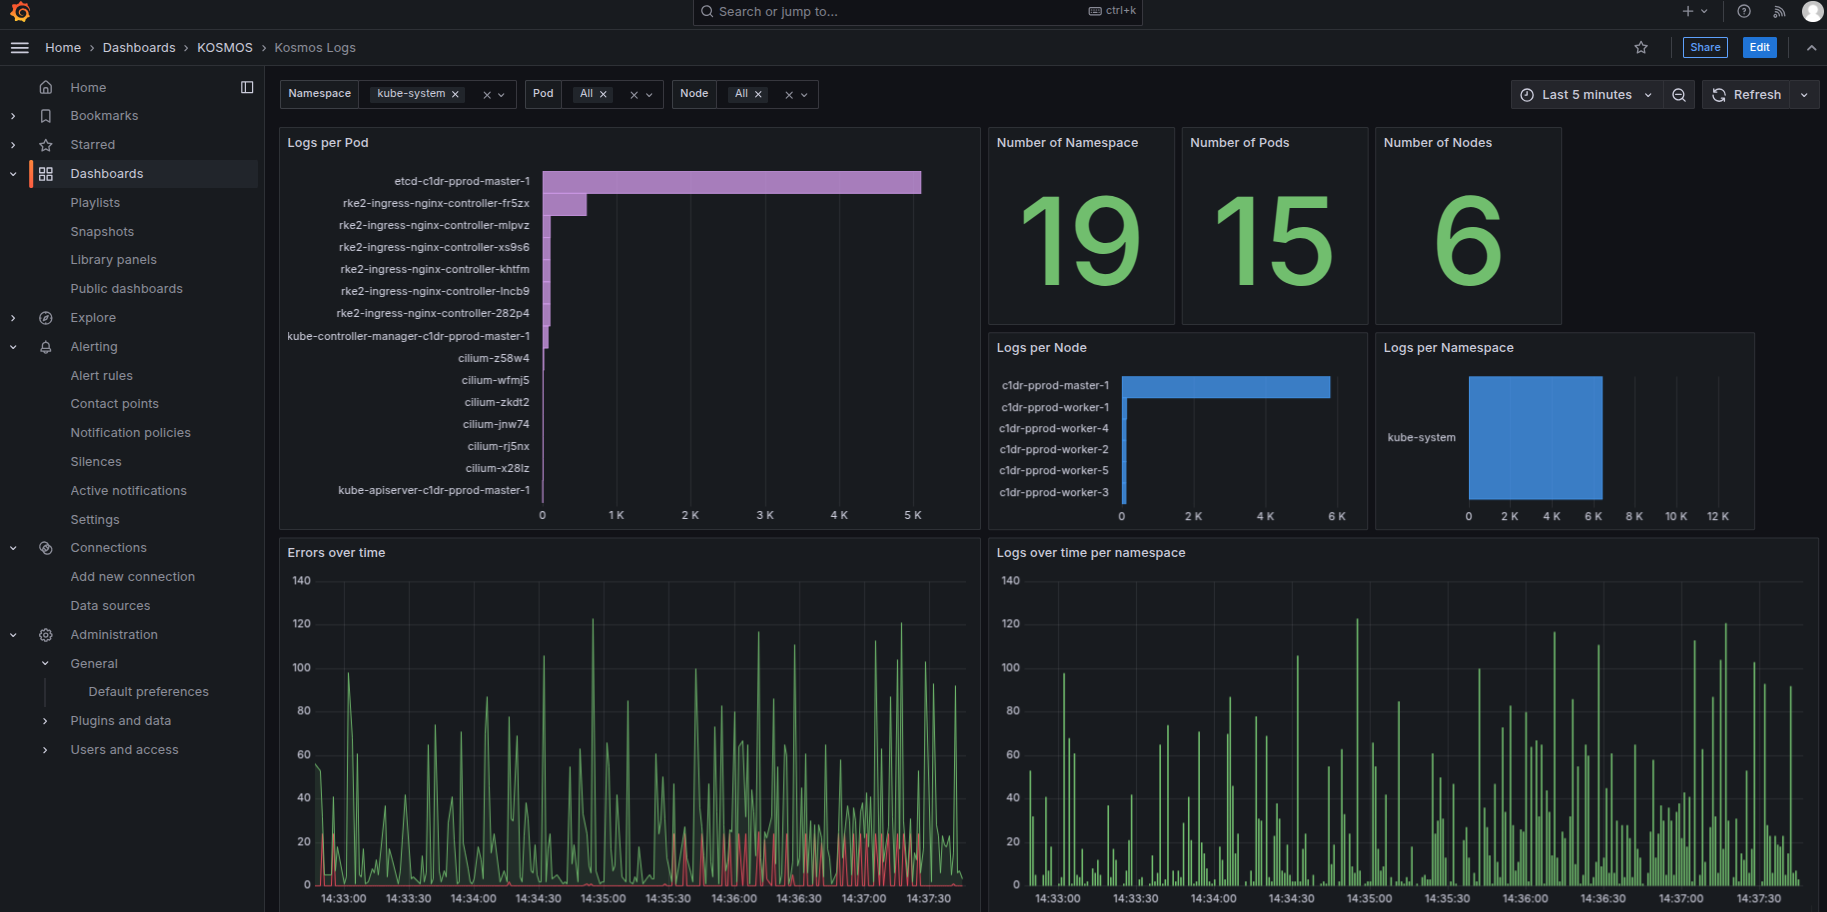
Checking Logs in Grafana Dashboards
- Log in to Grafana via the administration portal
- Select the dashboard
- KOSMOS > Kosmos Logs
- Check for the presence of logs
- Kubernetes Logs
Prometheus service status
Via the HMI
This procedure allows you to view the Kubernetes statistics history.
- Log in to the Prometheus application via the portal
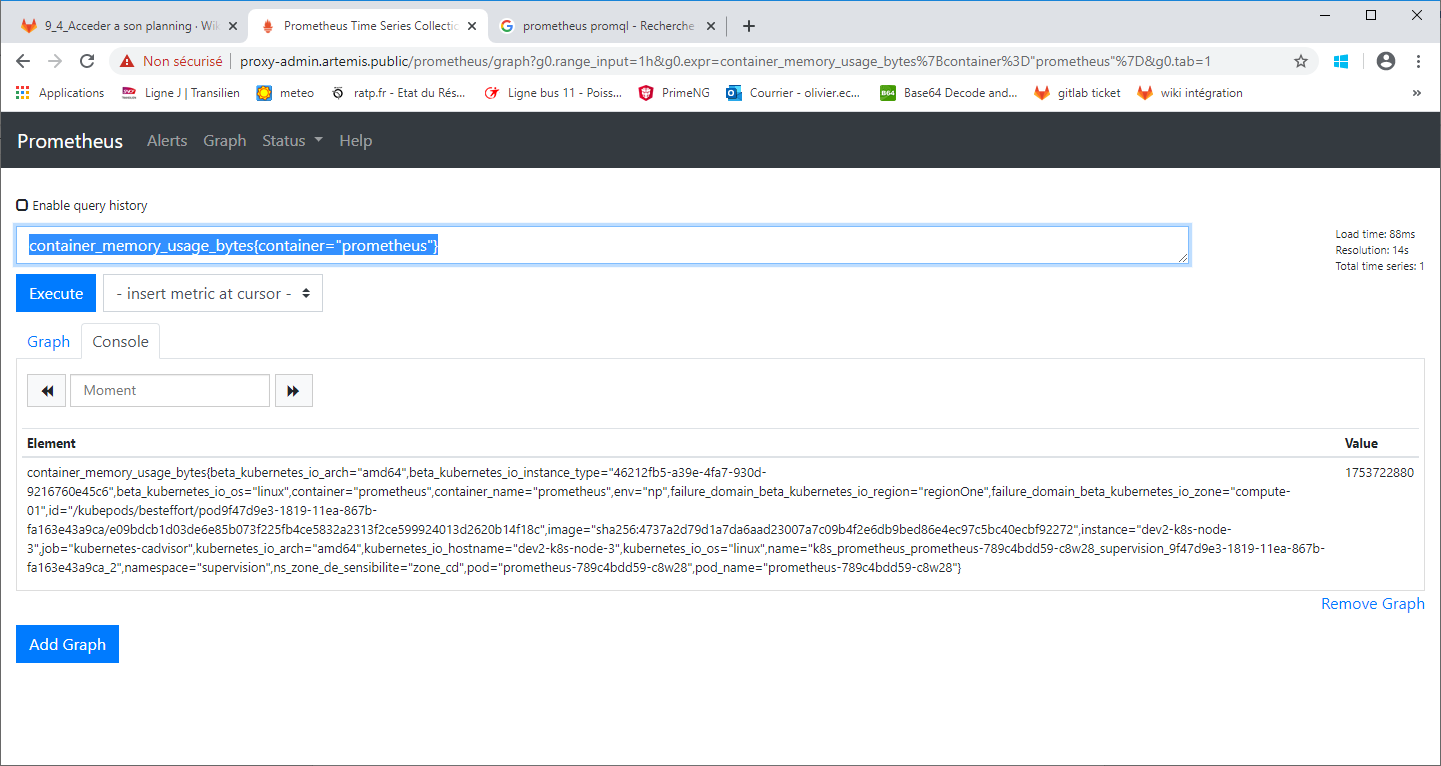
Search for a value
The Prometheus application homepage offers a search function using PromQL.
For example, enter the query container_memory_usage_bytes{container="prometheus"} to find the memory usage in bytes.
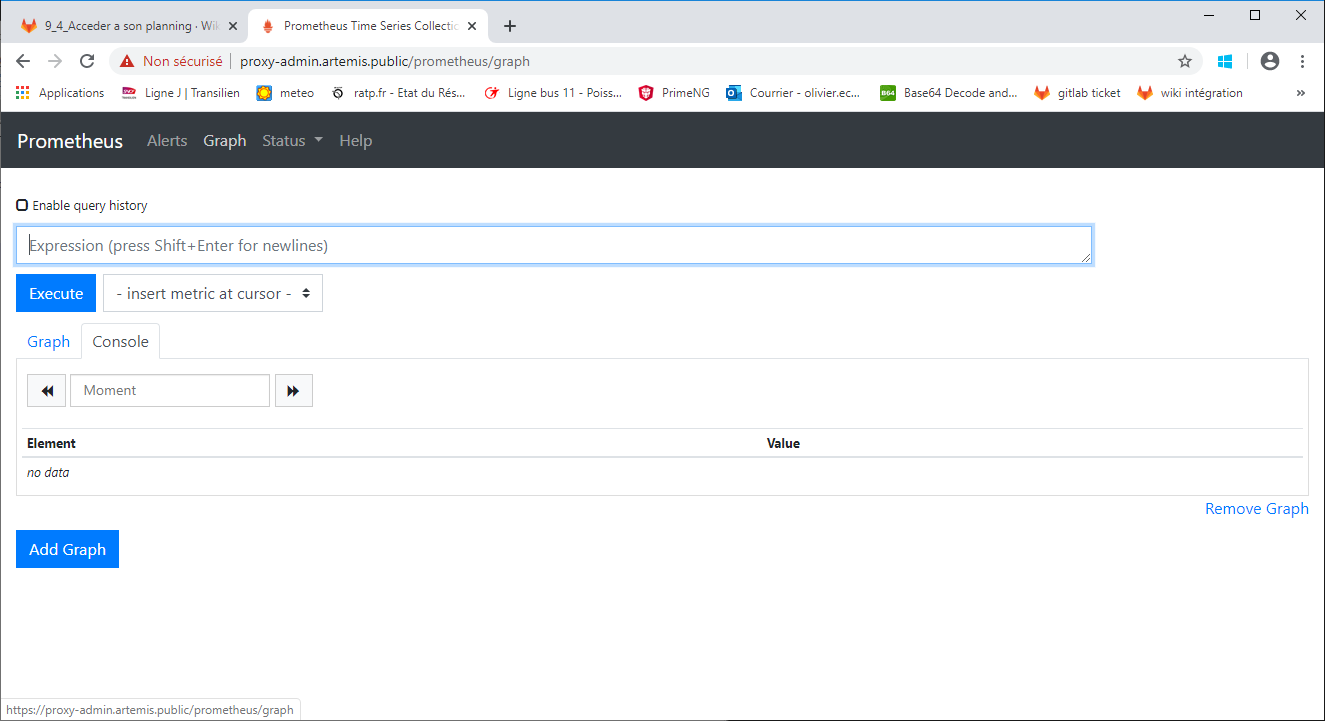
The searched item is displayed in the list on the "Console" tab.
View the history of an indicator
Click on the "Graph" tab.
The value history is displayed using the default time period.
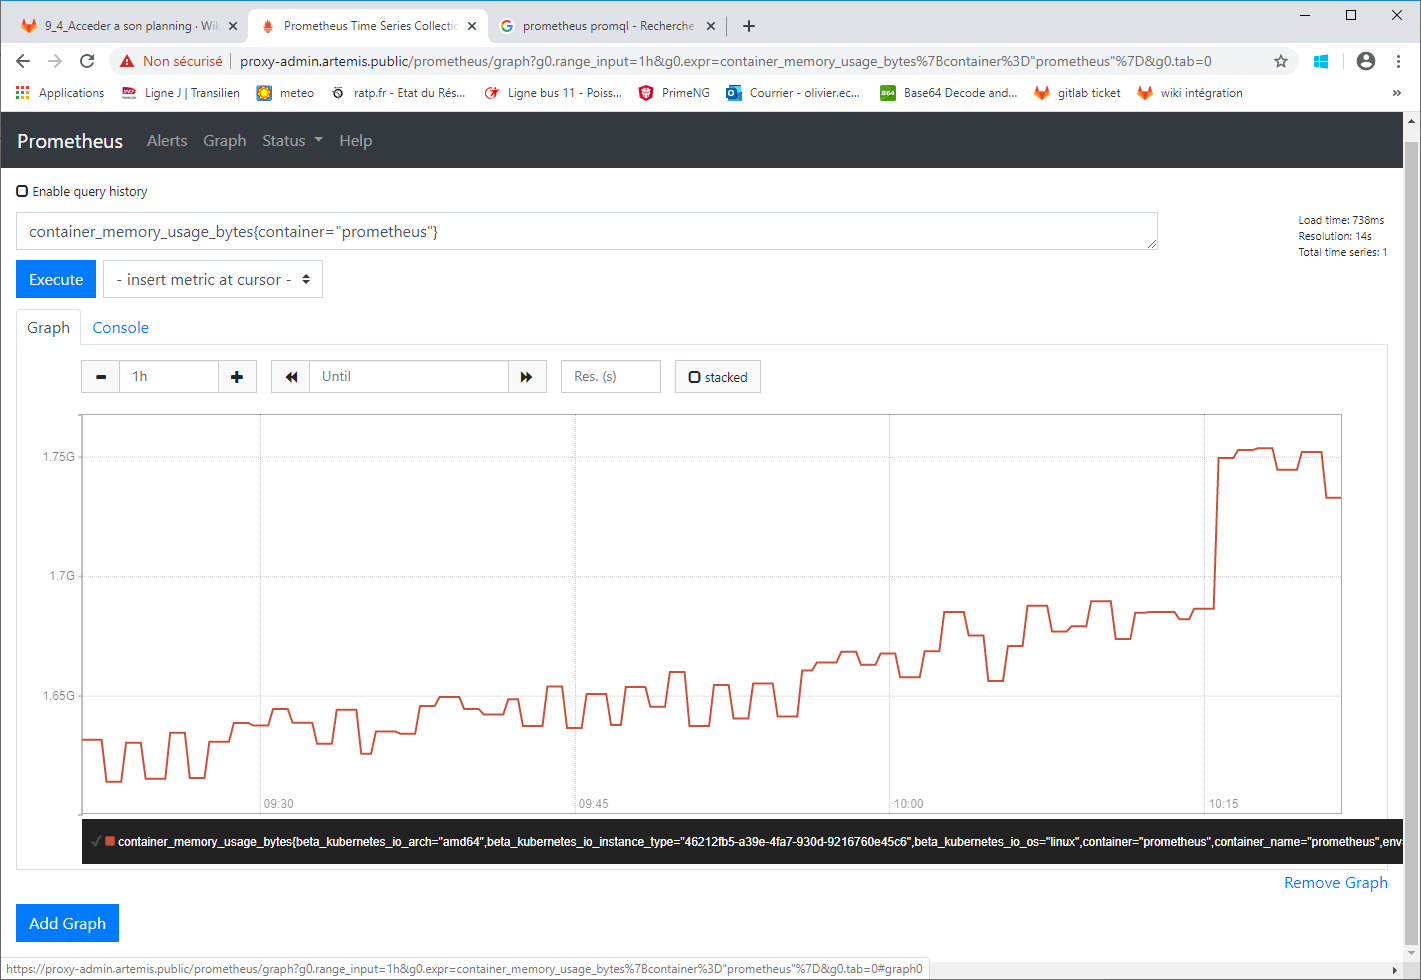
Choose the time period for an indicator's history
Click on a new time period
The indicator's history is displayed using the selected time period.